A new school year is upon us, and with it comes another round of Undergraduate Council elections. The UC elects three representatives from each of the 12 upperclass Houses and 4 freshman yards— plus the president and VP, who are elected separately, making a group of 50.
The UC is a major force on campus. The Finance Committee distributes $300,000 a year to student clubs, and UC leaders run everything from Thanksgiving shuttles to menstrual hygiene product installation in bathrooms. So it’s important that students are engaged in the UC elections.
 UC's Logo
But, last semester, we reported about how literally nobody voted in the Quincy midterm elections, among other signs of disturbingly low turnout. While it seems turnout this semester has improved (Quincy literally improved “infinitely,” if you will, since they jumped up from 0), unfortunately, there are still some glaring issues. Let’s jump into them.
Our open data source
At the Harvard Open Data Project, we are committed to holding Harvard’s institutions accountable through open information. We obtained official turnout data from Harvard’s Election Commission, which we have now made public, and below we’ll share our insights in the hopes of shedding light on the voting process and the outcome.
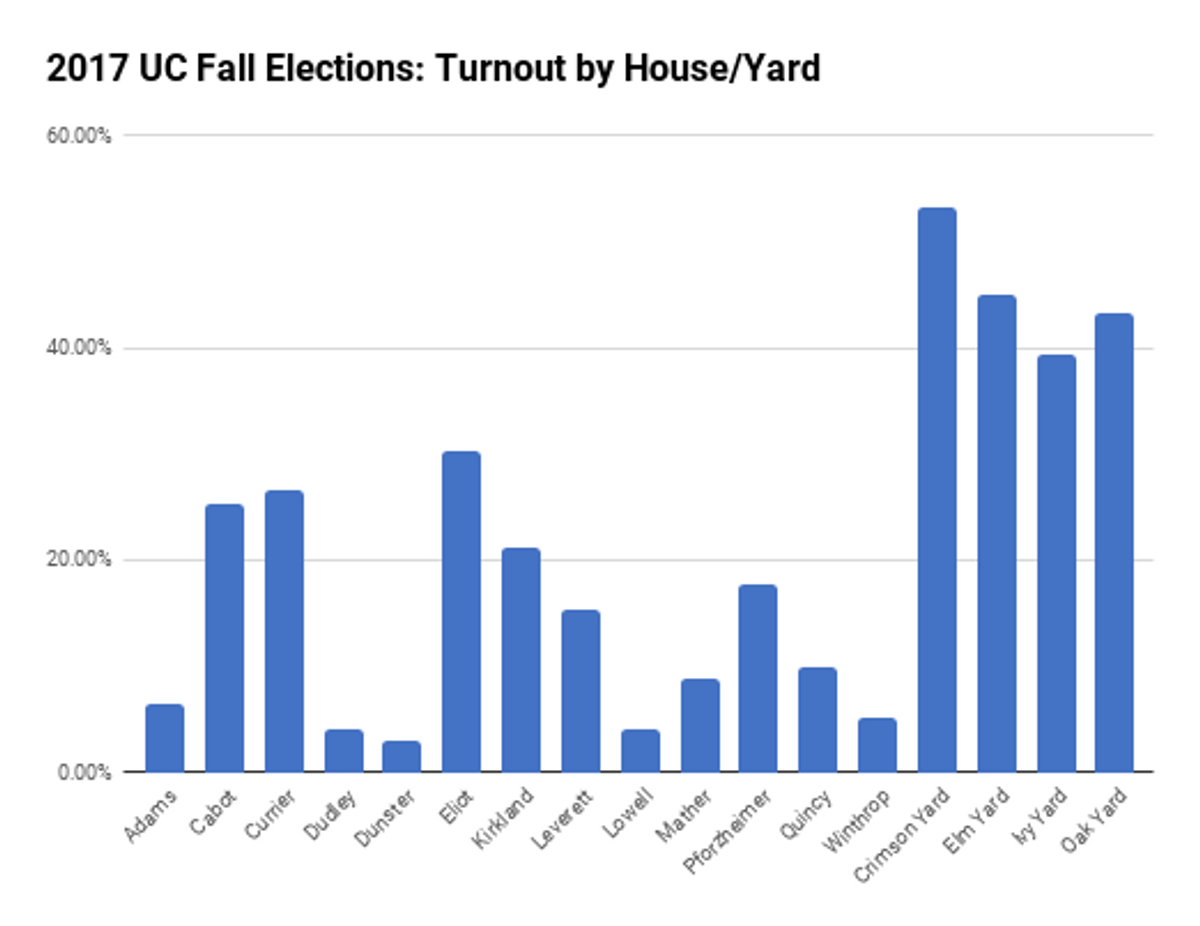 Voter turnout by house/yard. All graphs courtesy of Stephen Moon.
Despite having 402 eligible voters, Dunster’s turnout was abysmally low. However, this is understandable given than only 1 person was running in the first place. Junior Gevin Reynolds ran unopposed and was met with an expected victory. (To his credit, he earned 11 votes.)
Anyone in Dunster could have written in their name and won a seat on the Undergraduate Council.
This wasn’t an isolated incident. Adams, Dudley, Lowell, Mather, and Quincy were all no-contests as well. Everyone who ran got a spot. In fact, the most competitive race in the upperclass Houses was Pforzheimer, where 4 people vied for 2 open spots, an “admission” rate of 50%.
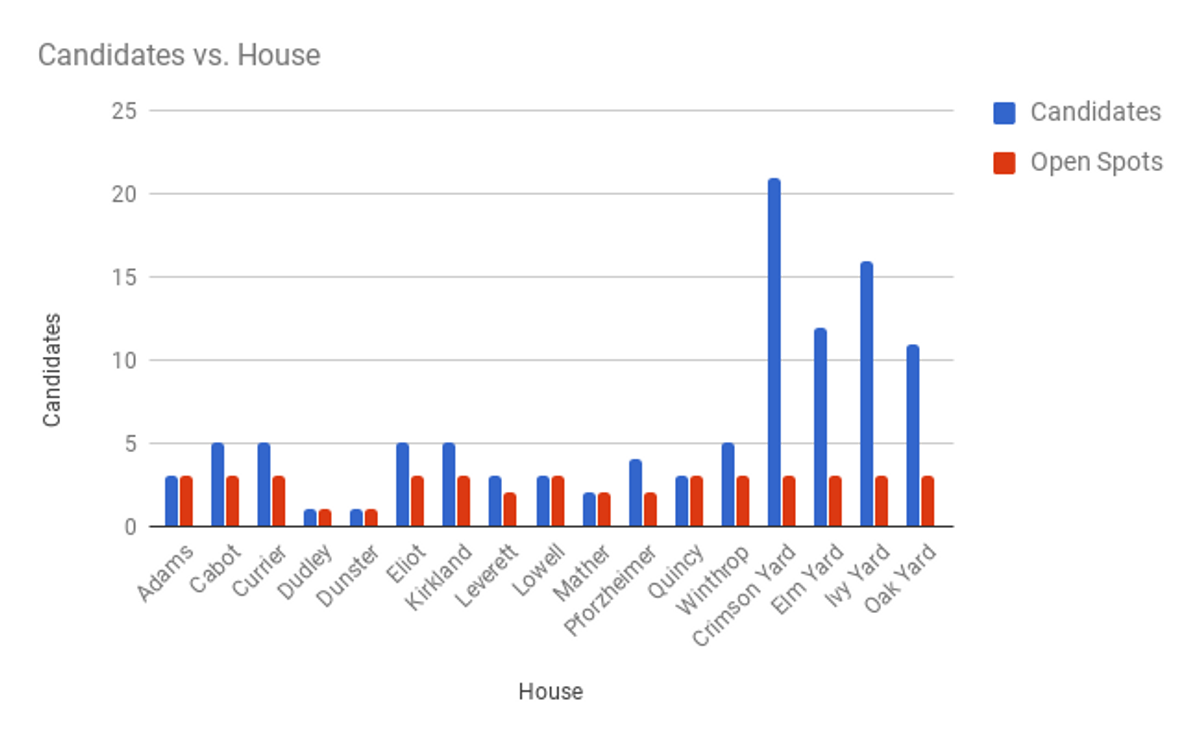 Several houses, such as Adams and Dunster, were uncontested. The freshman yards, seen on the right, were far more competitive.
Why the enthusiasm gap?
We brainstormed several hypotheses for why some houses had such abysmal turnout and why some fared better. The hypothesis most supported by the data was that more-contested elections attracted more voters than less-contested ones. This trend was generally true, but there were many exceptions.
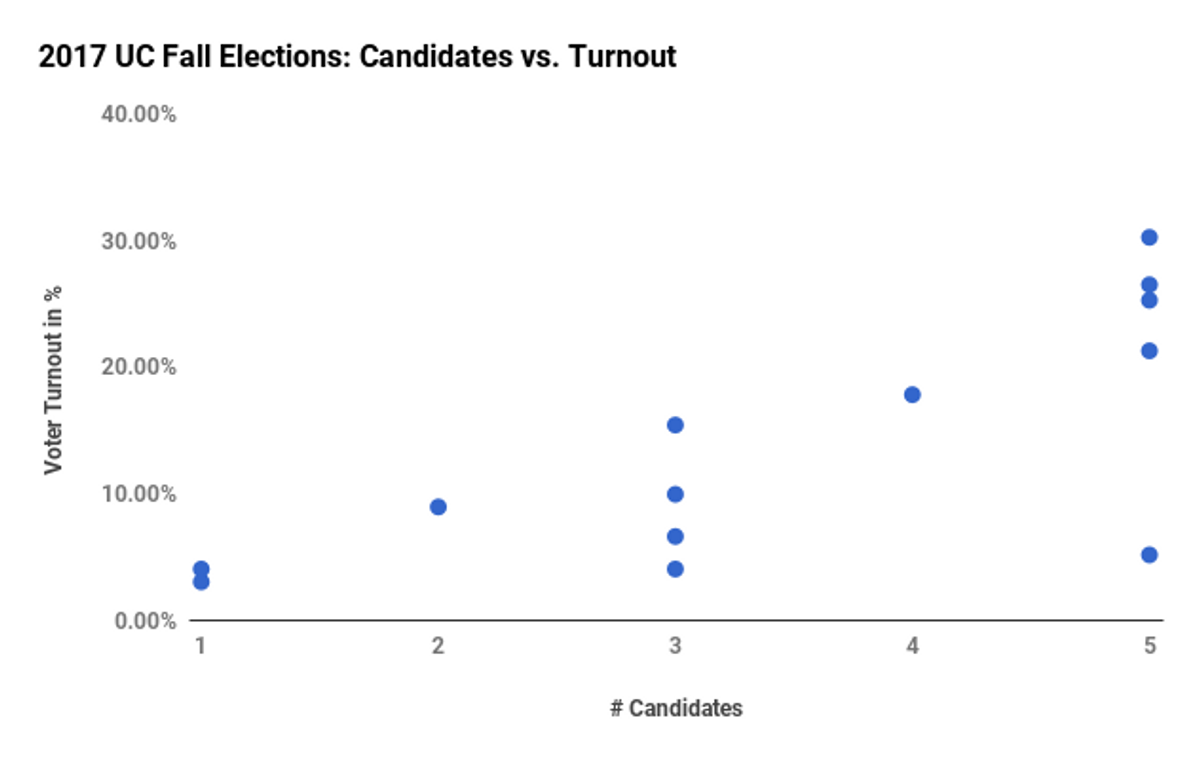 Generally, more candidates meant higher turnout, but this wasn’t true across the board.
Winthrop had 5 candidates in the running, but only 21 of the 410 eligible students, or 5.12%, voted. Mather had virtually no choice regarding their UC representative, yet their turnout (8.92%) still surpassed Winthrop’s.
In general, though, the houses with more candidates did seem to have higher turnout.
Insurgence in Eliot
 House of Eliot (play on House of Cards)
This fall’s Eliot UC election produced a record voter turnout of 30.25%.
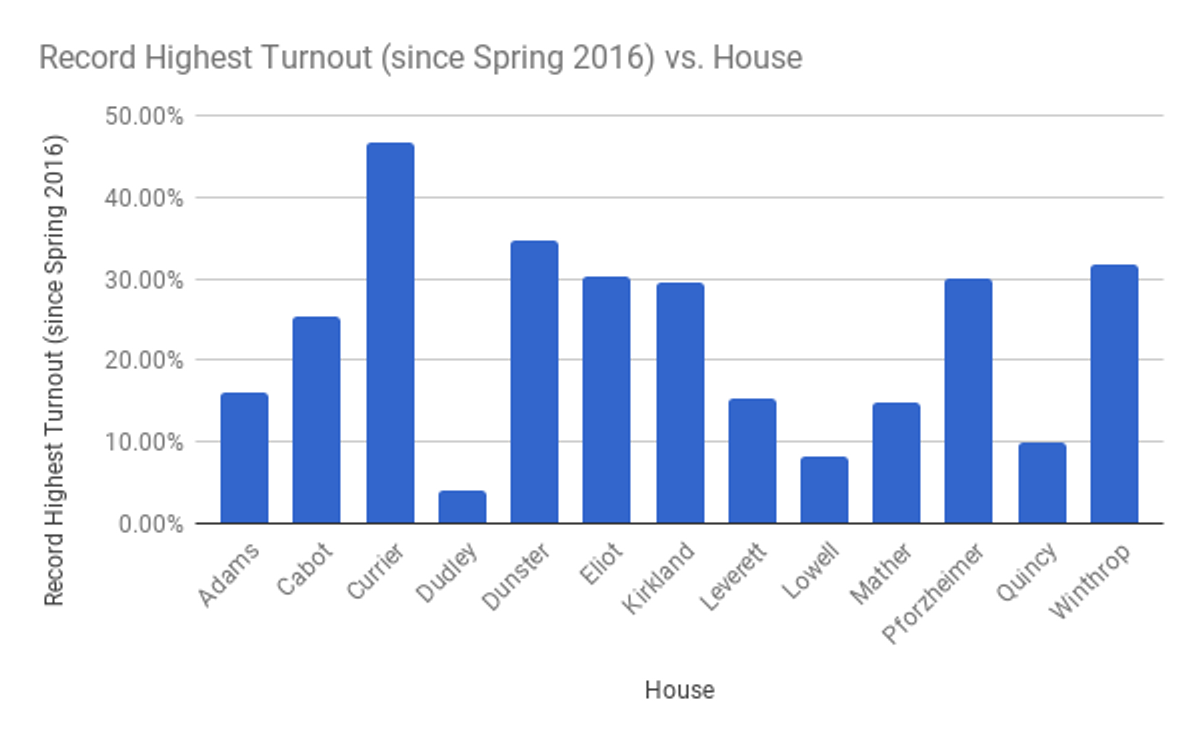 The highest turnout in each House since Spring 2016. Eliot set its all-time high this year.
In Eliot, 4 sophomores faced off against 1 senior for 3 coveted positions. One of the winning candidates, Arnav Agrawal, ran on a platform of providing free menstrual health supplies within the house and improving mental health services. These issues were also central to Agrawal’s freshman year successful UC platform. Perhaps this exciting race will set a precedent for other candidates in future elections.
Who knew freshmen were so politically engaged?

The freshman class had both the greatest amount of candidates and the largest voter turnout by a wide margin. Even the freshman yard with the lowest turnout, Ivy Yard (39.29%), had a better voter turnout than the upperclassman house with the highest turnout, Eliot (30.25%).
Overall, the freshman class’s voter turnout was a striking 45.38%. This relatively high turnout was more than three times as high as the overall voter turnout for upperclassmen, which was just 14.10%.
A call to action
While we might make fun of it sometimes, low voter turnout is a huge problem on campus. The UC was created specifically to give students, elected by their peers, the ability to change the Harvard experience. Failure to participate in this process is a waste of a valuable opportunity. Casting your vote is the easiest way to ensure that your voice is being heard and that you are adequately represented.
Most students will spend 4 years in college. It’s time to make them count.
