
Worldviews and Migration: How Social Identities May Shape Attitudes on Migration
How do differing social identities affect the favorability of migrants in different countries?
Introduction:
Migration has been a highly contested topic of political debate across the world over the past several years. It is especially important for policy, both targeted towards those in favor and against migration, to understand what the views of their citizens are. In this article, I analyzed how migration values (i.e., how people view migrants) across the United States, Russia, and the United Kingdom differ from one another when categorizing by survey respondents’ gender, race, and religiosity. The data for this analysis came from the World Values Survey (WVS) Wave 7, which has a wide collection of data for people from many different countries and surveys their views on a variety of subjects. I found that gender was not as significant a factor in migration values as initially hypothesized, with race and religion frequently emerging as statistically significant indicators of one’s migration values. Given that none of the three countries analyzed showed common trends, it is important to think about the different situations within each of these countries. The results of this analysis may help identify more precise strategies for shifting societal views of migration.
Data:
Data are from the World Values Survey (WVS). The WVS is a large dataset that surveys people from all over the world about their values. The specific WVS wave that I used contains data from 2017–2023. The dataset contains questions about individuals' perceptions about migration, as well as about person-level characteristics relevant to this article, including gender, race/ethnicity, and religiosity. In the analysis of the data, I compared the mean values (represented by “M”) between groups of people, where a higher mean value indicates more unfavorable views of migrants.
United States Migration Values:
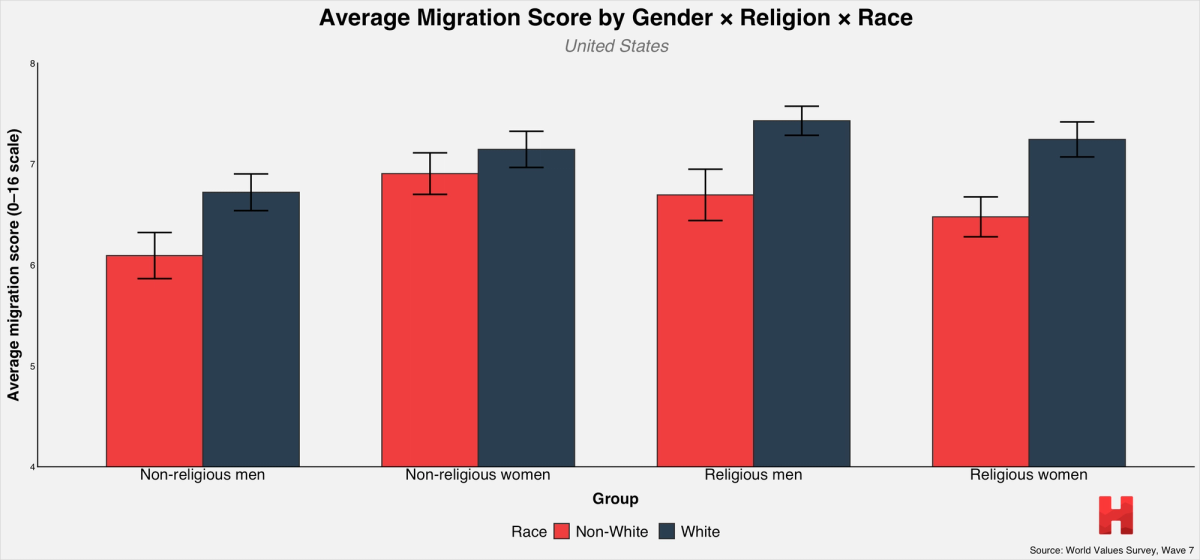 Figure 1. The Y-axis on this graph ranges from 4 to 8. The grey bars represent Non-White people, while the blue bars represent White people. The bars are grouped by religiosity and gender, with the Y-axis being their migration values. A higher migration score indicates a higher unfavorable view of immigration and immigrants.
In line with my hypothesis that religious White men would have the most unfavorable views of migrants, non-religious White men (M = 6.72) had a more favorable view of migrants than religious White men (M = 7.43). However, it was not predicted that non-religious White men would be more favorable of migrants than both religious White women (M = 7.24) and non-religious White women (M = 7.14). Across genders and religiosity, non-White respondents had more favorable views of migrants than their White counterparts. In line with my hypothesis, religious, White men had the most unfavorable views of migrants; however, I initially expected non-religious, non-White women (M = 6.90) to have the most favorable views of migrants, which was not observed within the WVS data. Despite non-religious, non-White women having more unfavorable views of migrants than their male counterparts (M non-religious non-White men = 6.09), this relationship reverses when considering religious, non-White respondents (M religious non-White men = 6.69, M religious non-White women = 6.48). In the case of this analysis, a higher mean migration score indicates highly unfavorable views of migrants.
Russia Migration Values:
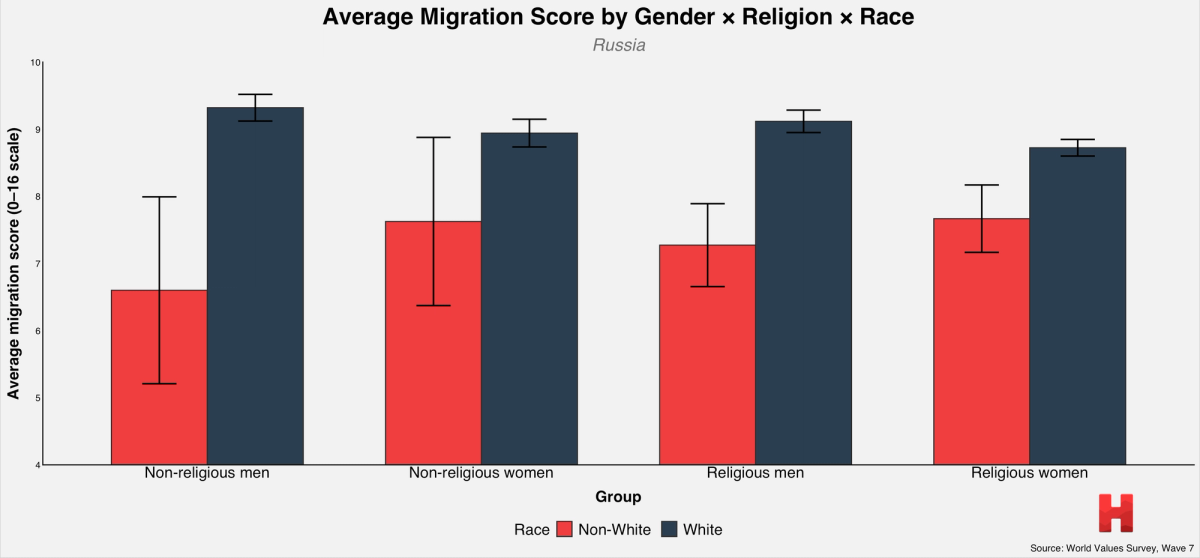 Figure 2. The Y-axis on this graph ranges from 4 to 10. The grey bars represent Non-White people, while the blue bars represent White people. The bars are grouped by religiosity and gender, with the Y-axis being their migration values. A higher migration score indicates a more unfavorable view of immigration and immigrants. There are very large error bars in the Non-White bars due to there being a far smaller number of them when compared to the White respondents, likely due to Russia being a majority White country.
Contrary to findings in the US, non-religious White men (M non-religious White men = 9.32) in Russia have far more unfavorable views of migrants than any other group surveyed. However, when comparing the migration scores of Russian respondents, it is important to note that the mean scores of all 4 groups of White Russians (M non-religious White women = 8.94, M religious White men = 9.12, M religious White women = 8.72) are significantly higher than those in the US. From this graph, there does not appear to be a significant influence of religiosity on the favorability of migrants, while race appears to have a substantial impact on the migration score (M non-religious non-White men = 6.60, M non-religious non-White women = 7.63, M religious non-White men = 7.27, M religious non-White women = 7.67). However, since there are fewer non-White Russian respondents than in the US and UK, the error bars are important in the analysis of the graph in interpreting the true effect of race on migration score within Russia. Additionally, a lack of non-White respondents may be a result of the very unfavorable views of migrants from White Russians across the levels of religiosity.
United Kingdom Migration Values:
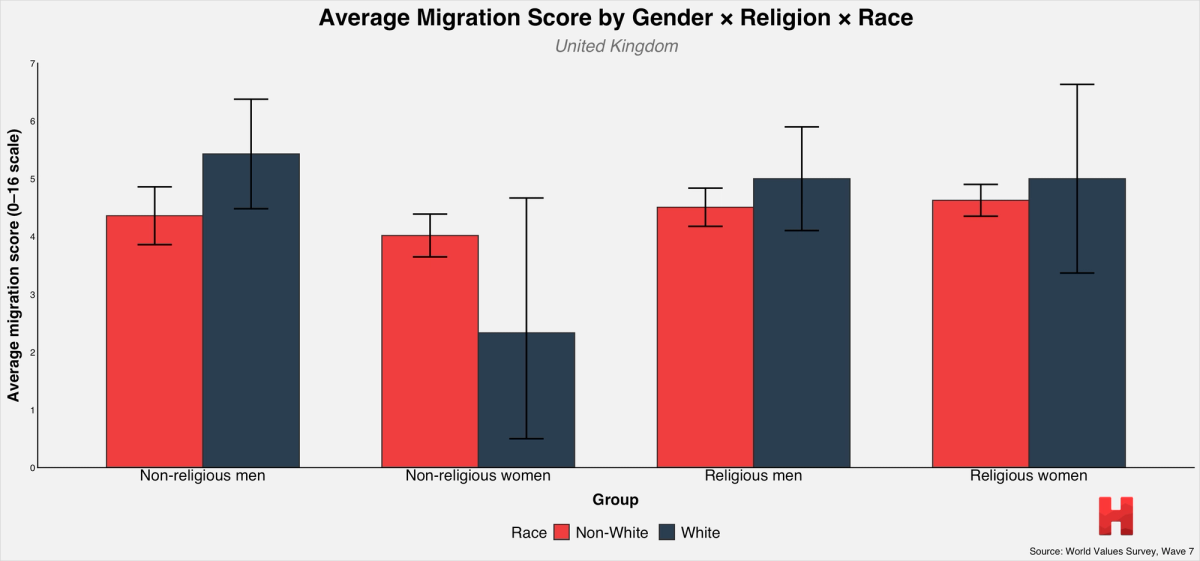 Figure 3. The Y-axis on this graph ranges from 0 to 7. The grey bars represent Non-White people, while the blue bars represent White people. The bars are grouped by religiosity and gender, with the Y-axis being their migration values. A higher migration score indicates a higher unfavorable view of immigration and immigrants. Large error bars in White women indicate a smaller sample size of White women surveyed compared to other groups.
The United Kingdom’s migration values have the largest differences when comparing non-religious White women (M non-religious White women = 2.33) to religious White women (M religious White women = 5.00), with religious White women having far less favorable views of migrants than non-religious White women. However, this trend appears to reverse when looking at non-religious White men (M non-religious White men = 5.43) and religious White men (M religious White men = 5.00). Non-White respondents across religiosity and gender (M non-religious non-White men = 4.36, M religious non-White men = 4.51, M religious non-White women = 4.62) appear to have fairly consistent views of migrants, with non-religious non-White women (M non-religious non-White women = 4.02) having the most favorable views of migrants amongst non-White respondents. Interestingly, it is only in the case of non-religious women that non-White respondents have more unfavorable views of migrants than White respondents. However, it is important to note that the size of the error bars for White women (regardless of religiosity) appears to have much larger error bars than any of the other groups, which indicates a smaller sample size of White women surveyed in the United Kingdom by the WVS.
Conclusion:
This article examined whether individuals’ perceptions about migration vary by personal characteristics (i.e., gender, race, and religiosity), and also explored whether these effects differ among countries. Gender, race, and religiosity had varying effects worldwide and across different countries. Given these vast country variations in values, this demonstrates how different the politics of each of these countries are in relation to migration, as well as how their different social groups respond to the topic. It is also likely that the migration values in each country are heavily influenced by the demographics of each country. Since the US is racially diverse, race was not a significant factor, while gender and religion were. However, since Russia is a very racially homogenous country, differences in race due to its increased salience are reflected in the vast differences in migration values by racial groups.