Mapping the Hometowns of Harvard Student-Athletes
Where the Crimson recruits its talent.
Introduction
While Harvard is more commonly known for its academic rigor, the university’s athletic program is remarkably impressive as well. Harvard offers a Division-I leading 42 intercollegiate sports teams who have won hundreds of Ivy League and NCAA titles. Roughly 20% of Harvard’s Class of 2019 played a varsity sport, with 12% coming to Harvard as recruited athletes according to an annual Crimson survey. And with the Harvard admissions trial offering new data and information to the public, there has been a recent increase in national media scrutiny on Harvard’s athletic recruitment and its impact on admissions.
Given the integral role of athletics on campus life, we wanted to investigate Harvard’s sports teams in terms of where athletes are from. Our main question was:
How does this differ when isolating factors of different sports, gender and class? Beyond geography, we also wanted to see if there were significant differences in the average wealth of athlete hometowns controlling for different factors.
Results
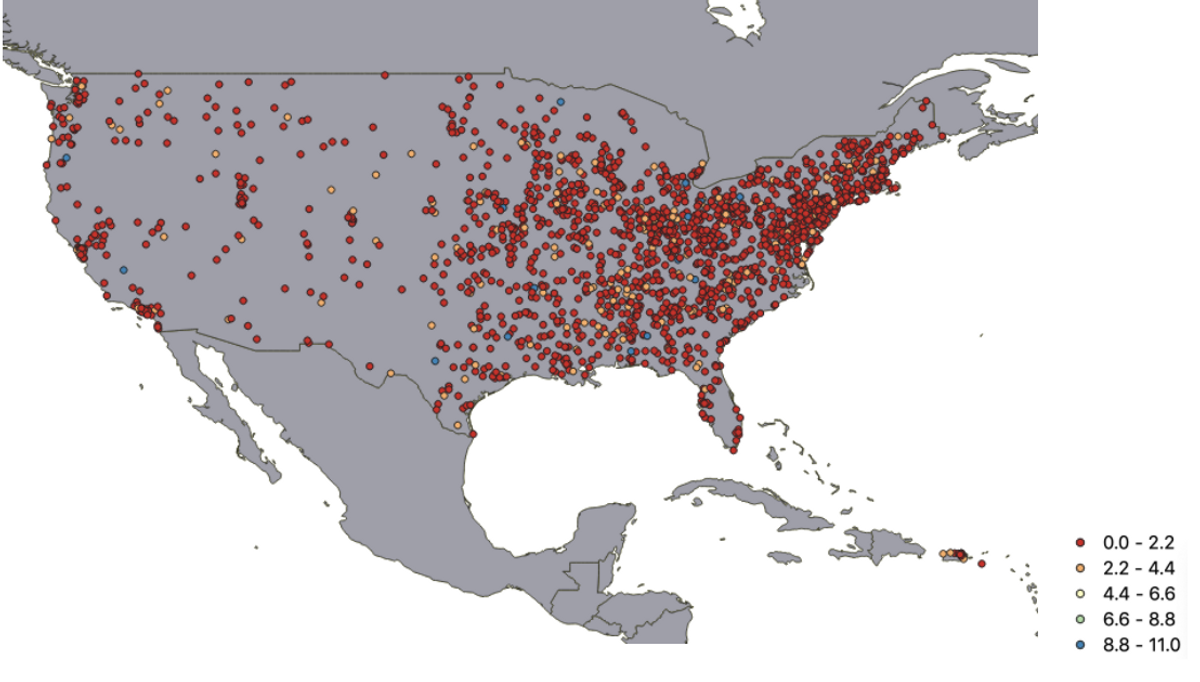
 Figure 1: A map of student-athletes’ hometowns, with the number of athletes from each town corresponding to the numbers in the legend.
Geography
The above graph plots the hometowns of each athlete, with the color of the dots indicating the number of athletes from that location. As can be seen, Harvard recruits athletes from all over the United States — almost if not every state in the US is represented by Harvard’s student-athletes.
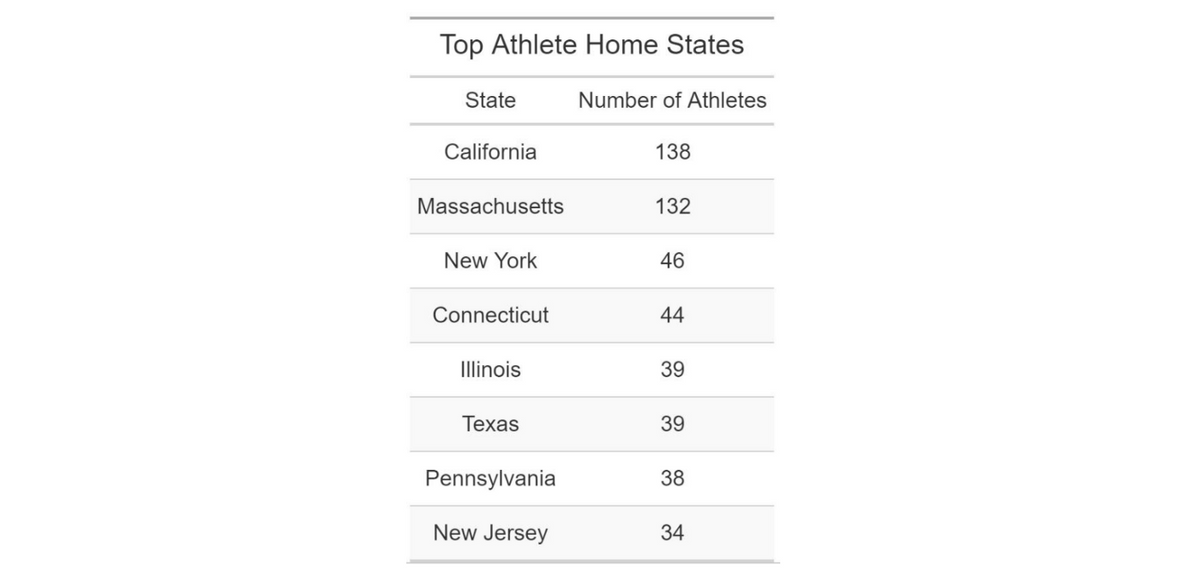
 Figure 2: States with the Most Harvard Athletes. As can be seen, states with larger populations and states closer to the East Coast display higher levels of athletes.
Figure 2 corroborates this spatial data; with the exception of California at the top of the list, states closer to the East Coast tend to have higher numbers of athletes. One explanation for this contrast is targeted recruitment: because Harvard and other schools in the eastern US compete with schools in the western US to recruit athletes, Harvard may either a) initially target more East Coast high school athletes due to their proximity, allowing for an easier scouting and recruitment process or b) have a higher yield for athletes who come from the East Coast in the first place.
Median Hometown Household Income
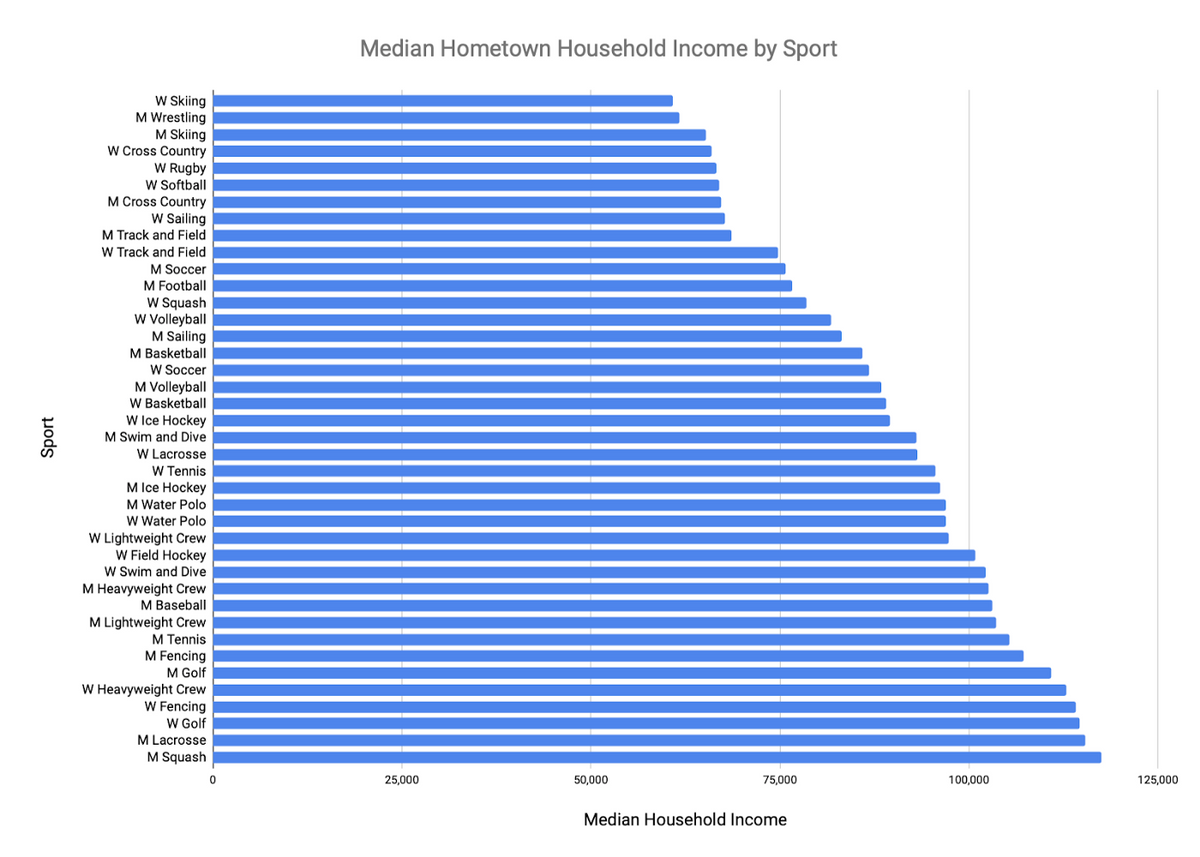
 Figure 3: Median household income of U.S.-based student-athletes from various Harvard teams.
The median household income by sport was calculated by taking the median of the median incomes of the hometowns of all U.S. athletes in each sport. Sports with both male and female teams generally display similar median household incomes. In particular, Men’s and Women’s Skiing represent two of the three lowest incomes, Men’s and Women’s Track and Field are both in the lower 25th percentile, Men’s and Women’s Water Polo both have the same median income, and Men’s and Women’s Golf are both in the top 25th percentile.
However, it’s important to note that this data is limited. First, it only features athletes from U.S. hometowns — for example, the Women’s Squash team has only four U.S. athletes while the Men’s Squash team has six U.S. athletes, and thus the median household incomes for those teams may not be representative given the small sample size.
In addition, it’s possible that the median household income of each individuals’ hometown doesn’t necessarily indicate the athlete’s household wealth. Information regarding athletes’ family incomes compared to the overall Harvard student body can be found from the Crimson’s annual survey. However, the average wealth of athletes’ hometowns nonetheless gives a good indicator of whether certain sports have athletes from wealthier areas.
Conclusion
In conclusion, we sought to find out where Harvard’s athletes come from around the country and world, and whether there were differences in their hometowns by sport or other factors. We found that in general, Harvard’s athletes come from all over the United States, although much more come from the eastern half (and specifically, the Northeast US) than from the western US. In addition, we found that there were noticeable differences in the average household income of hometowns between different sports. Specifically, more training, equipment, and facilities-intensive sports such as Lacrosse and Golf demonstrated higher median household incomes while less equipment-intensive sports such as Track and Field and Cross Country demonstrated lower median household incomes. Overall, looking at Harvard athletes’ hometowns before college provides interesting insights into Harvard’s athletic recruitment process and the backgrounds of Harvard’s student-athletes.
Data and Methods
The data used for this analysis was collected from the Harvard Athletics website, where each athlete’s hometown and high school are published. Because the hometowns were not formatted uniformly across all athletes, e.g. Massachusetts abbreviated as MA or Mass., we cleaned the data using the GeoPy package in Python to ensure that all of the locations were in the same format. The cleaned data then allowed us to plot the locations on a map using QGIS. In addition, we used the hometowns from the cleaned data set to collect median household income data of each town from Data USA. One important note is that we excluded athletes who listed international hometowns — our aggregation only included athletes who listed hometowns in the United States in line with our Data USA source.
