
Which Concentrations Have the Most Enjoyable Courses?
How much do undergrads actually enjoy these courses, and what is the average enjoyment of courses between concentrations according to the students’ subjective discretion?
Introduction
Every conversation between people at Harvard contains at least one mention of their concentration. There are 50 undergraduate concentrations, each with its own “pinnacle” courses. However, how much do undergrads actually enjoy these courses, and what is the average enjoyment of courses between concentrations according to the students’ subjective discretion?
Methodology
Our data comes from QReports, the course evaluation report system that Harvard uses for all its undergraduate and graduate courses, available to Harvard affiliates to fill out after the conclusion of the course. We first took a varied sample of Harvard’s concentrations and courses that represented each concentration with sufficient enrollment (which varies across the number of students in each concentration). We used the most recent QReports possible, ranging from 2023 Fall to 2025 Spring. We extracted the data from the “Course General Questions,” which allows students to evaluate the course, its materials, and its assignments, and “How Strongly Would You Recommend This Course to Your Peers?” which allows students to give a rating for how much they would recommend this course to future students. Both of these were in the form of tables on the original website, and we extracted them as CSV files, converted them into pandas DataFrames, and moved them into Python for analysis. We used approximately 5 courses from each concentration in an attempt to create a more representative sample.
After cleaning the data with pandas and compiling it into CSVs, we could use DataWrapper and matplotlib to create our visualizations.
Insights
One factor that represents how much the students enjoyed the course in the department is the mean “recommendation rate” of all the students, ranging from a score of 1-Definitely not Recommend to 5-Recommend with Enthusiasm.
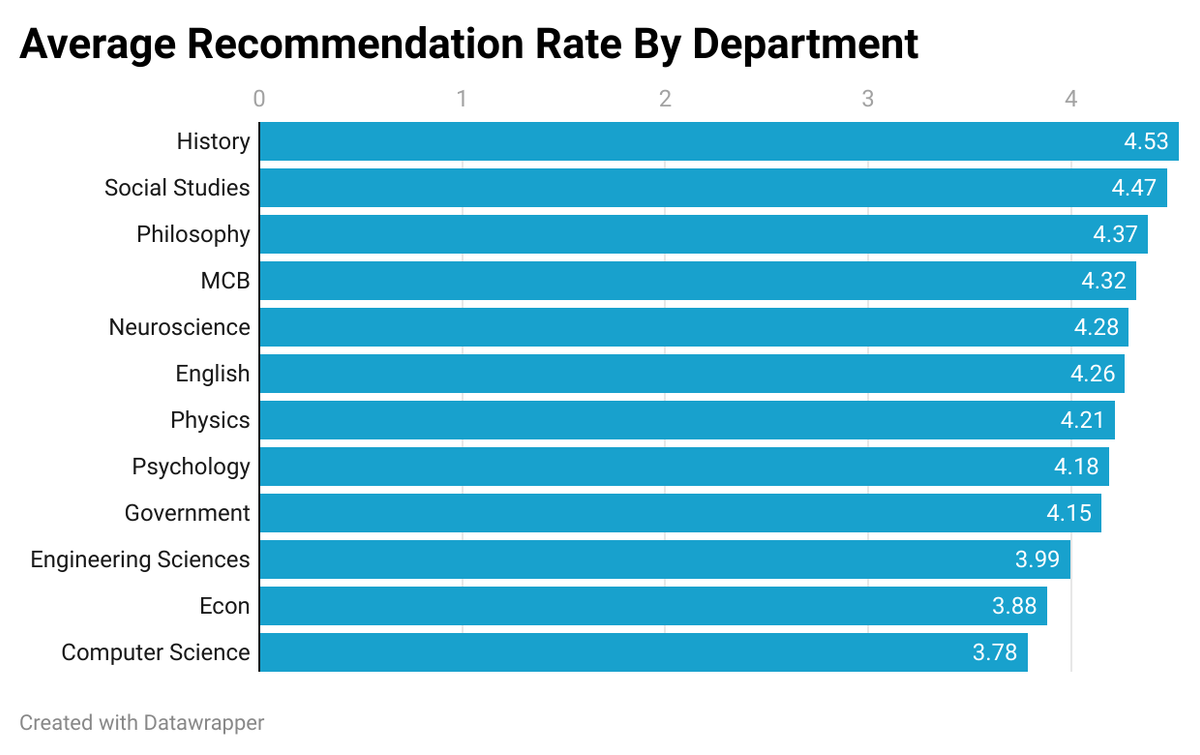 Figure 1.
The above plot shows the average recommendation rate, compiled the mean recommendation rate of each course, and averaged it across all the courses chosen for the department. We can see that the core courses (namely HIST 1333 - Hegel and Marx, HIST 1465 - The United States and World Order Since 1900, HIST 1301 - Western Intellectual History: The Prehistory of Modern Thought, HIST 1045 - The First World War, HIST 1125: Reasoning from the Past: Applied History and Decision Making) from the History department have the highest average recommendation rate of 4.53, while core courses (COMPSCI 61 - Systems Programming and Machine Organization, COMPSCI 1240 - Data Structures and Algorithms, COMPSCI 1200 - Introduction to Algorithms and their Limitations, COMPSCI 171 - Visualization, COMPSCI 1820 - Planning and Learning Methods in AI) from the Computer Science department have the lower average recommendation rate of 3.78. There is no apparent correlation between the recommendation rate of humanities and liberal arts courses compared to that of STEM courses—both MCB and Neuroscience have relatively high rates of recommendation, while History has a comparatively low rate of recommendation.
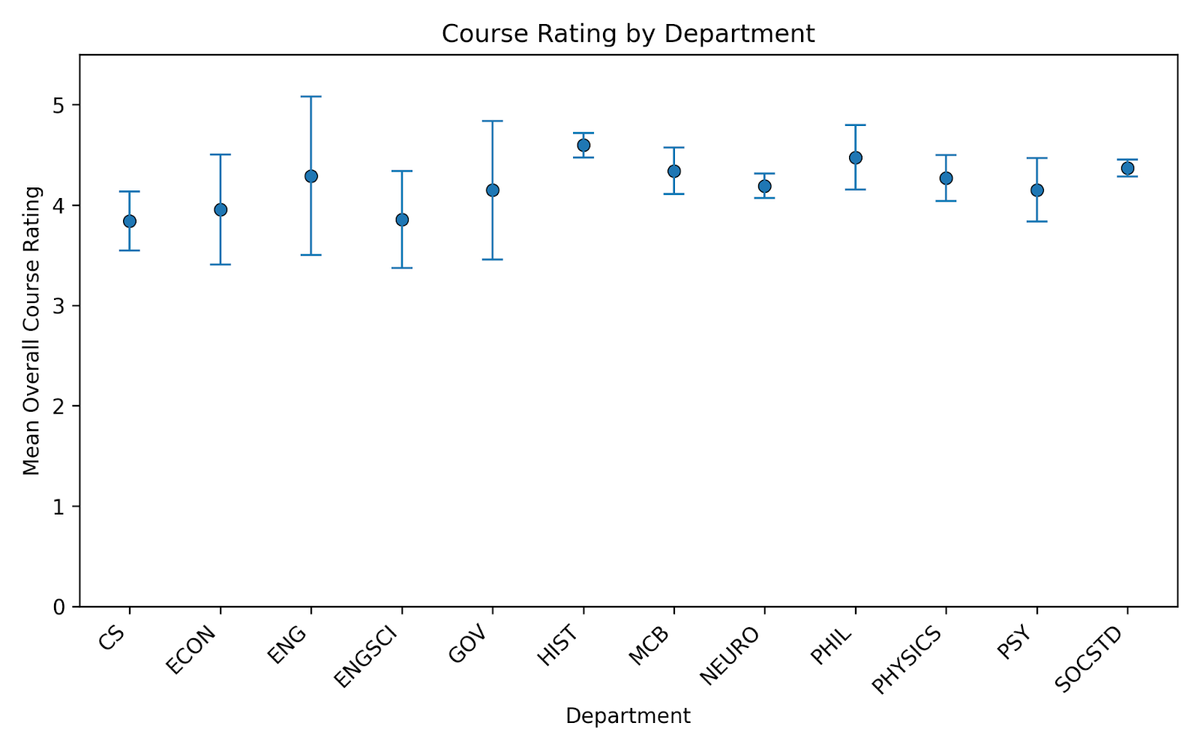 Figure 2.
In addition, we can look at the average of the students' overall evaluation of the courses within each concentration. For each concentration, we computed the mean overall rating (the “enjoyment level”) of the courses in that concentration and the standard deviation of the overall ratings as the spread. We can then compare departments in which most courses are solidly good according to students (high mean, low spread) and departments with courses that are hit-or-miss (high/medium mean, high spread). We can see that Social Studies, Neuroscience, and History have the least spread in course ratings, indicating consistently high overall ratings of courses. English courses, on the other hand, have a large spread, which means that there was more variability in how students evaluated the course. Other concentrations with more of a spread include Economics, Engineering Sciences, and Government.
Now, we look at a comprehensive visualization of the average ratings of all course aspects across departments to see if there is any significant difference between concentrations.
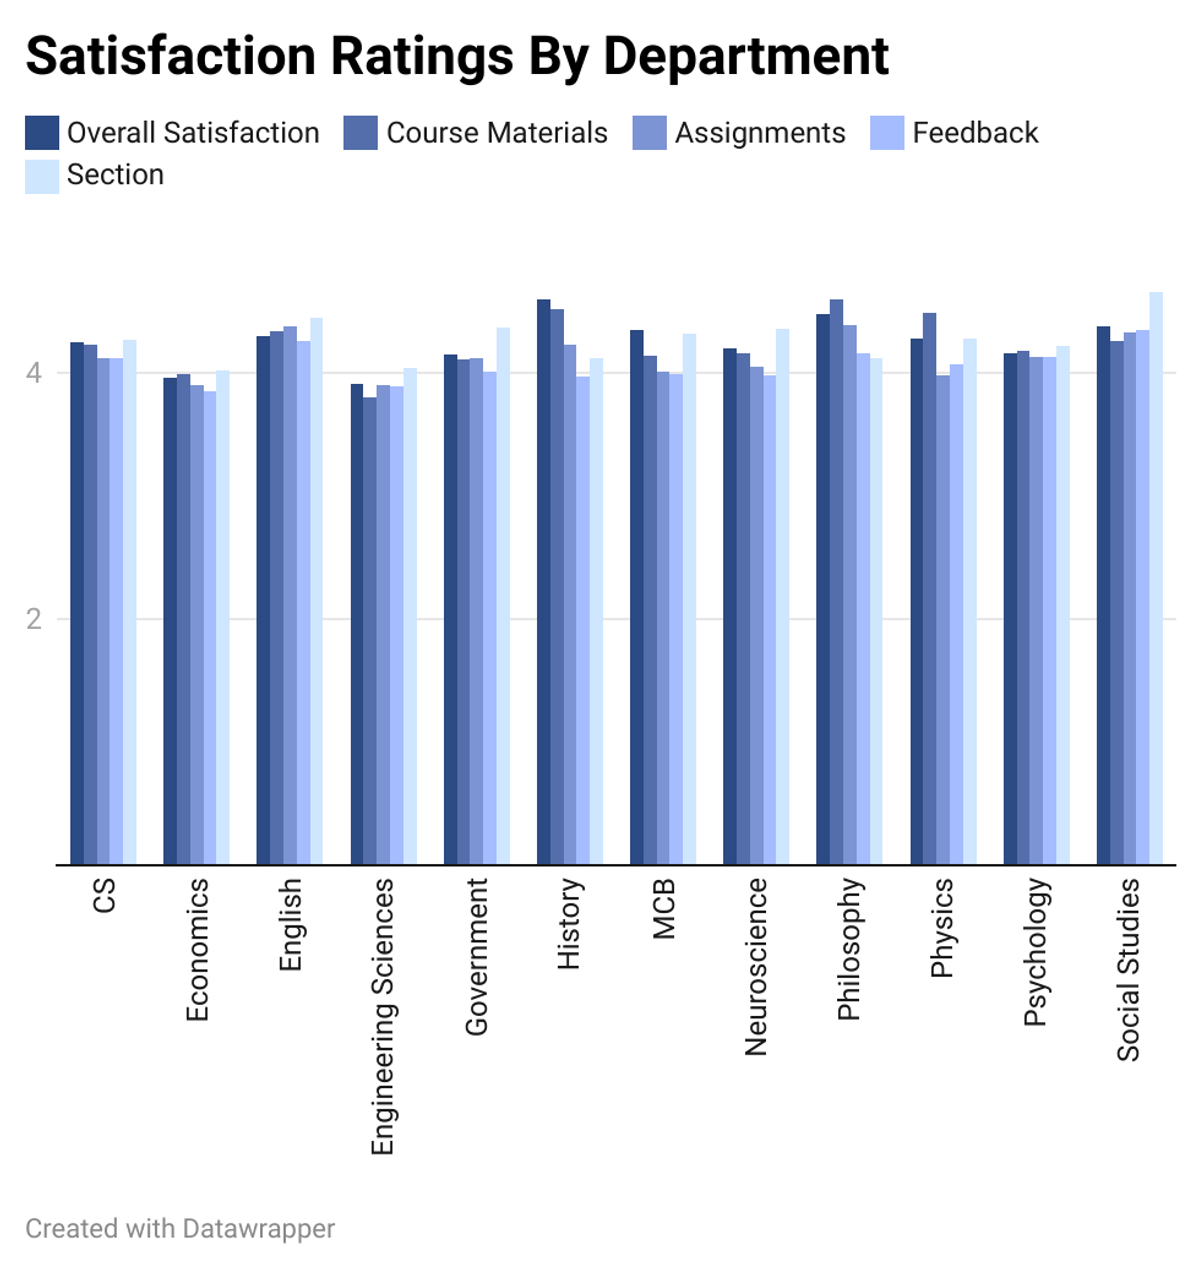 Figure 3.
We can see from the above figure that we have similar ratings across departments, but the trends on which aspect of the course rates the highest vary within the concentrations. In general, History and Philosophy have the widest spreads in satisfaction ratings of different aspects of the course. In general, the section component of the course has the highest satisfaction rating across all concentrations.
Now we can dive a little bit deeper into students' evaluations of the overall course, as well as the defining feature of most Harvard courses–the work done outside of actual class within these departments.
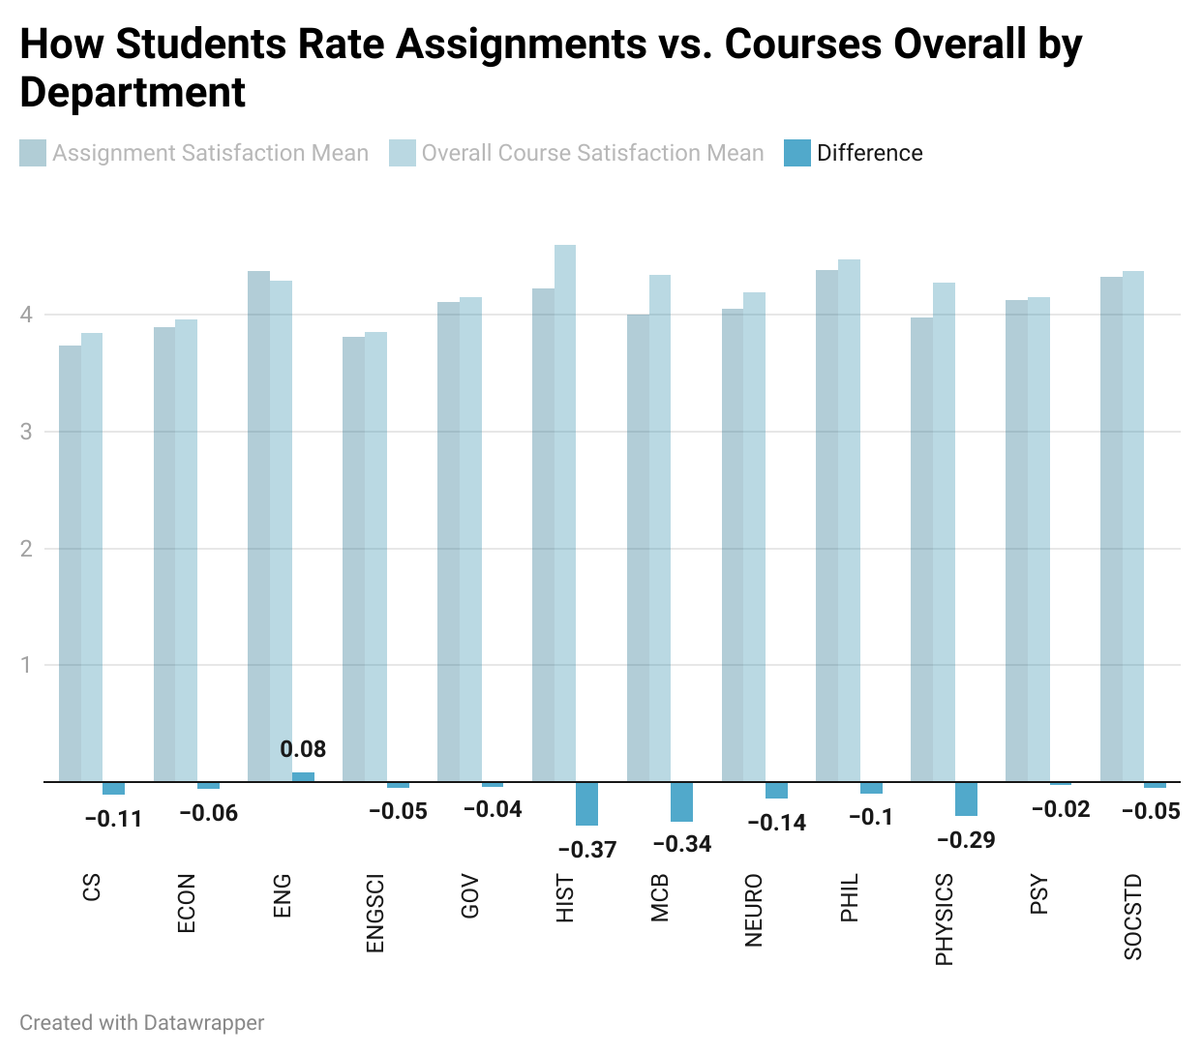 Figure 4.
We took the average of the course mean from the “Assignments (exams, essays, problem sets, language homework, etc.)” and the “Evaluate the course overall” row of course general questions across all the chosen courses in the department. In all departments besides English, on average, assignments consistently lag behind course enjoyment. In English, on average, the courses chosen (namely English 20 - Literary Forms, English 97 - Sophomore Tutorial, English 10 - Literature Today, English 178 - the American Novel, English 151 - The Age of the Novel) have assignments rated higher than the overall course, possibly suggesting that the structure of work (most likely essays in English) is a key positive driver of enjoyment.
From the plot, we can see that the three departments with courses where the discrepancy between assignment satisfaction and overall course satisfaction is the greatest are History, Molecular and Cellular Biology, and Physics. In the courses within these departments, it is possible that the difficulty of assignments outside of class takes away from the enjoyment of in-class activities and lectures.
Limitations, Unanswered Questions, and Future Work
There are many possible limitations to the scope of this project–one is that our sample size is very small in comparison to the amount of QReport data Harvard has. Due to some of the drastic differences in the number of concentrators in each department, some courses had very low enrollment compared to the courses in other departments, which could have skewed the means. The amount of usable data from courses within each department also varied, so some departments had a variety of courses we could use, while others only had a couple.
We calculated means in our analysis instead of the median, which allows for more extreme opinions on courses to possibly skew the results, potentially influencing our findings. If three people really disliked a course while seven others really enjoyed the course, which is not an uncommon situation, a median would have potentially yielded a less skewed result.
Finally, due to limited experience with many of these departments, most of the courses we selected were based on the concentration requirements. Some departments with more flexible requirements, such as History (where students are allowed to choose which courses they take within each category), may have led to some selection bias in which students took the course, compared to departments like Physics that require all concentrators to take a set of fixed core courses regardless of personal interest.
There are many aspects of the extracted data, and thus relationships between variables that could have been explored. We could also examine the relationship between whether the course tends to be polarized in its evaluation (division between excellent and fair/unsatisfactory, or a more centered distribution between very good/good). This would require more thought into how to compile the course data in a way that we could compare across departments. We could choose to go in a direction that looks at the causes of course enjoyment more deeply, like we did with our assignment analysis, but look for the correlation between all aspects of the (sections, course materials, feedback on assignments) and overall enjoyment of the course.
Conclusion
With this sample of QReports, we found that students’ ratings of courses varied between concentrations, and didn’t fall cleanly between humanities vs. STEM, as there was not a statistically significant variation. Both the dot plot showing the consistency in course ratings across departments (Figure 2) and the column chart showing comprehensive satisfaction ratings (Figure 3) do not show a significant difference in satisfaction between courses deemed humanities and STEM.
However, when we analyze the recommendation rates in Figure 1, History, Social Studies, and Philosophy courses were the highest recommended, while Engineering Sciences, Economics, and Computer Science were the least recommended, which provides key insights into which concentrations’ courses students enjoy enough to recommend to future students.
However, despite the varied enjoyment of courses, for almost all concentrations, students rated courses higher than their assignments. Only English had higher assignment enjoyment ratings than course ratings. English also had the largest spread in mean course rating, meaning that there were more differing opinions on the overall quality of courses, and thus, most likely a higher variability in enjoyment.
This data is only a small section of Harvard’s expansive QReports, and it had uneven distributions of concentrators and usable data. Despite this, we hope that these insights will help incentivize further discussion on courses and their connection to educational enjoyment at Harvard, and which concentrations have the most courses worth exploring, according to past students.
GitHub repo with raw/cleaned data and analysis: here