Behind the Beat: Harvard's Headliners at Yardfest and Crimson Jam
Introduction
Every year Harvard students cross their fingers as performers for Crimson Jam and Yardfest are announced. We can’t help but compare our performers to those at other colleges, but how popular are our performers really? Here, we’ll break this question down by looking at Spotify analytics and the attitude of Harvard students towards each performance, as well as some general trends in Harvard headliners.
Data Collection
To find performances, we searched the Harvard Crimon’s articles and found records of Yardfest and Crimson Jam all the way back to 2004. Many Harvard students compare our performers to Northeastern’s, which include big names like Carly Rae Jepson, Kesha, and Snoop Dogg. So, we also gathered information about Northeastern through their Instagram account: @northeasterncup.
Popularity
To see how famous the artists are, we looked at their monthly listeners on Spotify. Because we could not access records of monthly Spotify listeners from the year they performed, we could only gather the current monthly listeners from April 2024. This means our measure may not wholly capture their popularity levels in the context of the year they performed. Before Yardfest got its name, it used to be called Springfest. So some data is under the Springfest event title.
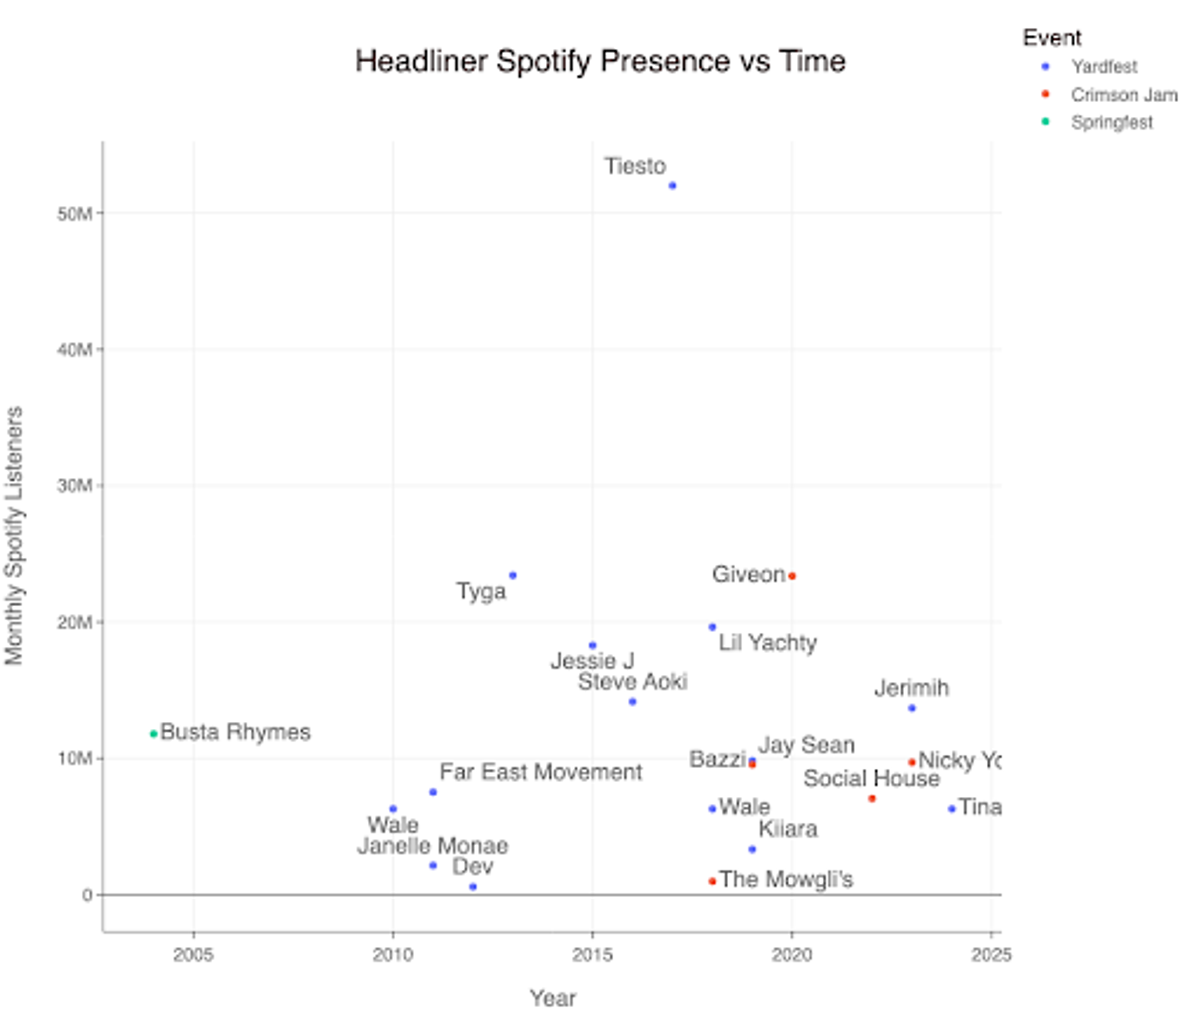 Figure 1: Scatter plot showing Harvard performers’ monthly Spotify listeners over time. There seems to be no significant difference in performer popularity for Crimson Jam vs. Yardfest.
Most performers were in the 5 million to 15 million listeners range, with a couple lesser known artists like Dev (650k+) and The Mowgli’s ( < 1 million) and well-known artists like Tyga and Giveon ( > 23 million). Dutch DJ Tiesto, who performed at Yardfest in 2017, had a whopping 52 million monthly Spotify listeners, making him the most well-known Harvard performer. There does not seem to be any significant difference in performer popularity for Crimson Jam vs. Yardfest.
Gender Makeup
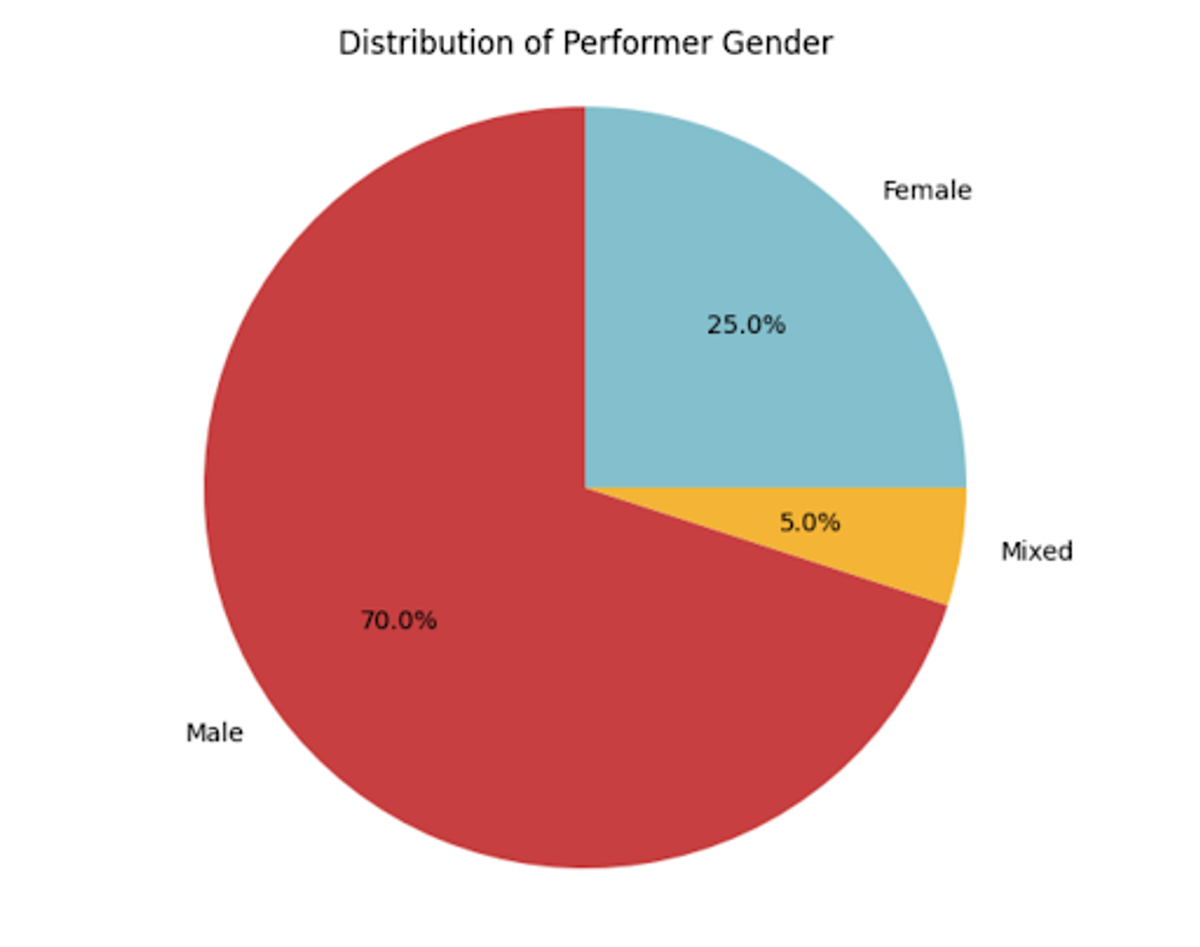 Figure 2: Pie chart depicting the distribution of performer gender. Most performers were male.
Next, we looked at the gender breakdown of Harvard headliners. There are significantly more male performers in these events than female or mixed groups — male performers make up 70% of all performers.
Genre Breakdown
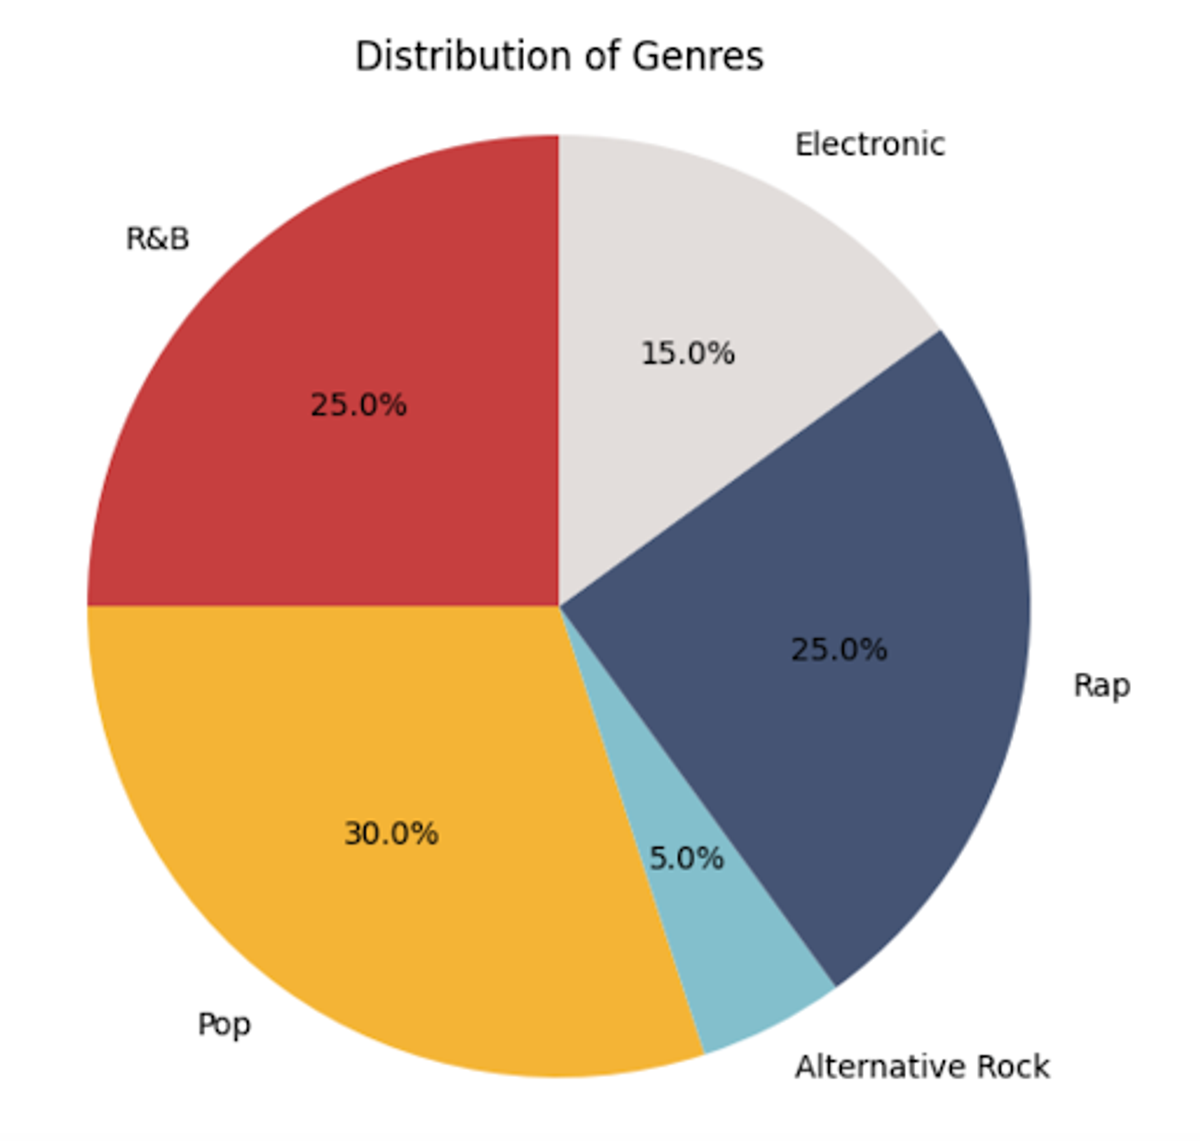 Figure 3: Pie chart depicting the distribution of music’s genre. Most of the music was pop, rap, or R&B.
Looking at the music genre of each performer, Harvard has a good variety. No single music category dominates, but the most frequent genres are Pop (30%), Rap (25%), and R&B (25%).
Student Body’s Opinion of Performers
To gauge student opinion of the performers, we looked at the Crimson’s article titles covering Yardfest and Crimson Jam. We used every non-image/gallery headline in our analysis (image/gallery headlines tend to be purely descriptive). Using Python’s Natural Language Toolkit, we assigned each performer an average sentiment analysis score.
Scores range between -1 and 1, with -1 being most unfavorable, 1 being most favorable, and 0 being neutral.
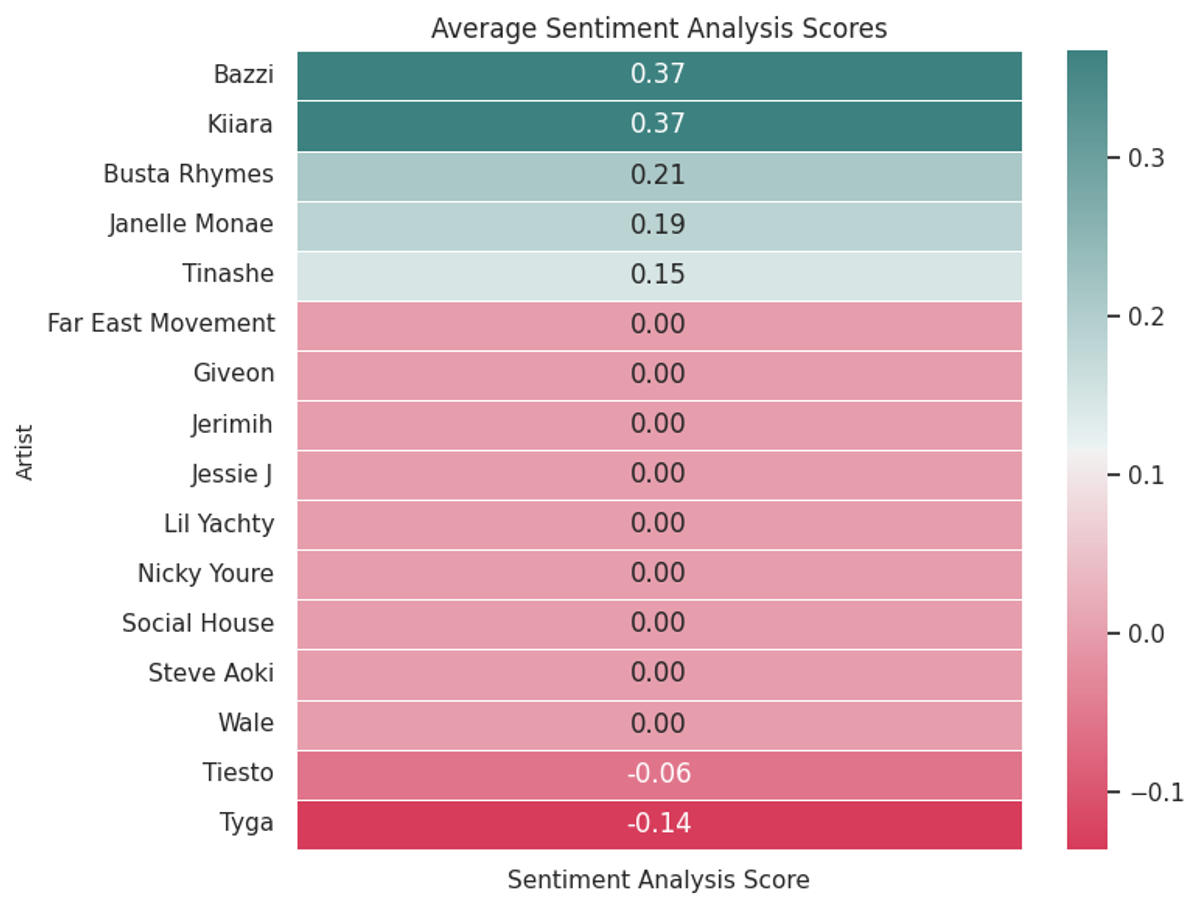 Figure 4: Divergent color chart showing sentiment analysis scores for each Harvard headliner. The red represents negative sentiment and the blue represents positive. Bazzi had the highest student popularity, while most students were disappointed with Tyga’s performance.
*Absent: Jay Sean, The Mowgli’s, Dev (These artists had no individual headlines feature in the Crimson).
The majority of scores were 0, indicating that the Crimson, and perhaps the student body as a whole, feels generally neutral towards Harvard headliners. Bazzi and Kiiara have the highest average sentiment analysis scores at 0.37. The lowest average score - Tyga - could perhaps be attributed to a large controversy surrounding his selection for Yardfest in 2013. Numerous Crimson articles covered Tyga’s misogynistic lyrics and the resulting student frustration and protests.
How Do We Compare to Northeastern?
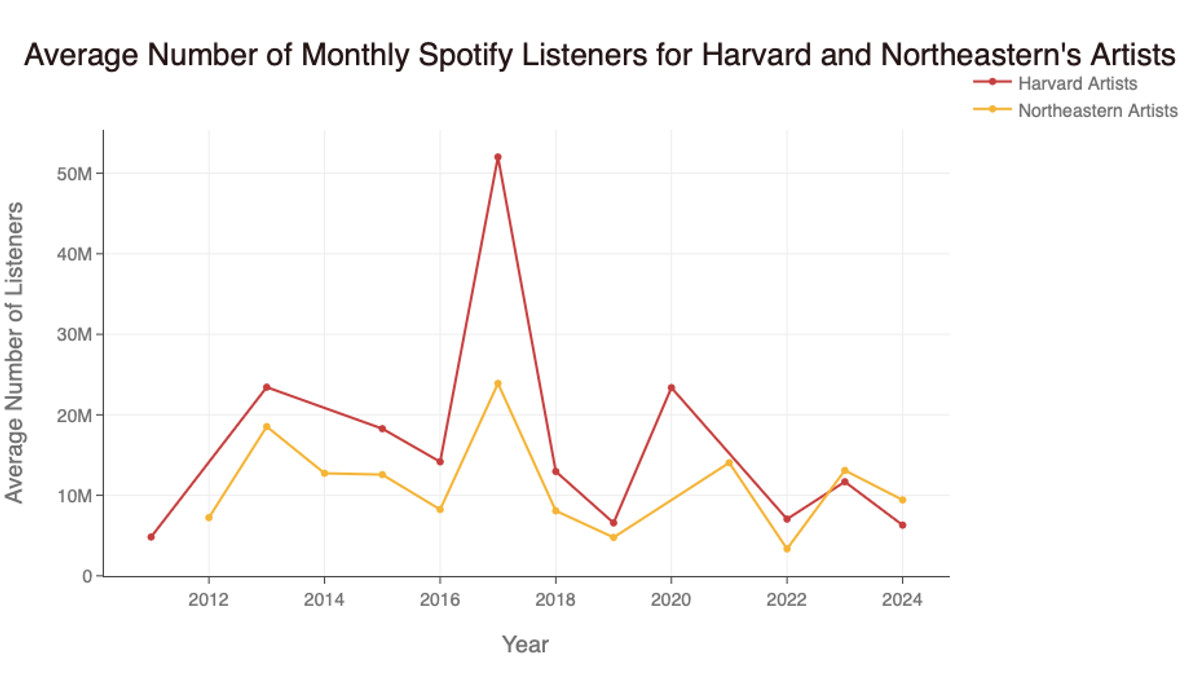 Figure 5: Line chart depicting the average number of Spotify listeners for Harvard and Northeastern headliners over time.
Finally, we looked at the popularity of Harvard performers vs. Northeastern performers to see who had the better music scene. We see that the popularity of Harvard performers generally outperforms that of Northeastern. Northeastern and Harvard performers follow similar trends, suggesting that perhaps there are other factors influencing artist popularity.
Conclusion
Harvard has a wide range of performers, from popular to music genres, but we could improve the gender diversity in our headliners. Generally, the Harvard student body feels neutral towards the performers, and our performers tend to be a bit more popular than Northeastern’s.
